Data visualization
This guide explains how to render charts, tables, and other visual content in DIAL Chat from your application code. It covers three approaches: built-in Markdown rendering, built-in Plotly chart support, and custom visualizers for anything else. You should be familiar with building DIAL applications using the DIAL SDK or the raw Unified API.
Markdown rendering
DIAL Chat automatically renders Markdown in the content field of any assistant message. Tables, links, inline images, code blocks, and LaTeX formulas all work out of the box—no extra configuration or special fields required.

To return Markdown from your application, write it directly into the response content. With the DIAL SDK:
with response.create_single_choice() as choice:
    choice.append_content(
        "| Month | Savings |\n"
        "| --- | --- |\n"
        "| January | $250 |\n"
        "| February | $80 |"
    )
Without the SDK, set the content field in the assistant message of your HTTP response body:
{
  "role": "assistant",
  "content": "| Month | Savings |\n| --- | --- |\n| January | $250 |\n| February | $80 |"
}
For the full list of supported content types (attachments, stages, LaTeX), see Custom content in Chat.
Plotly charts
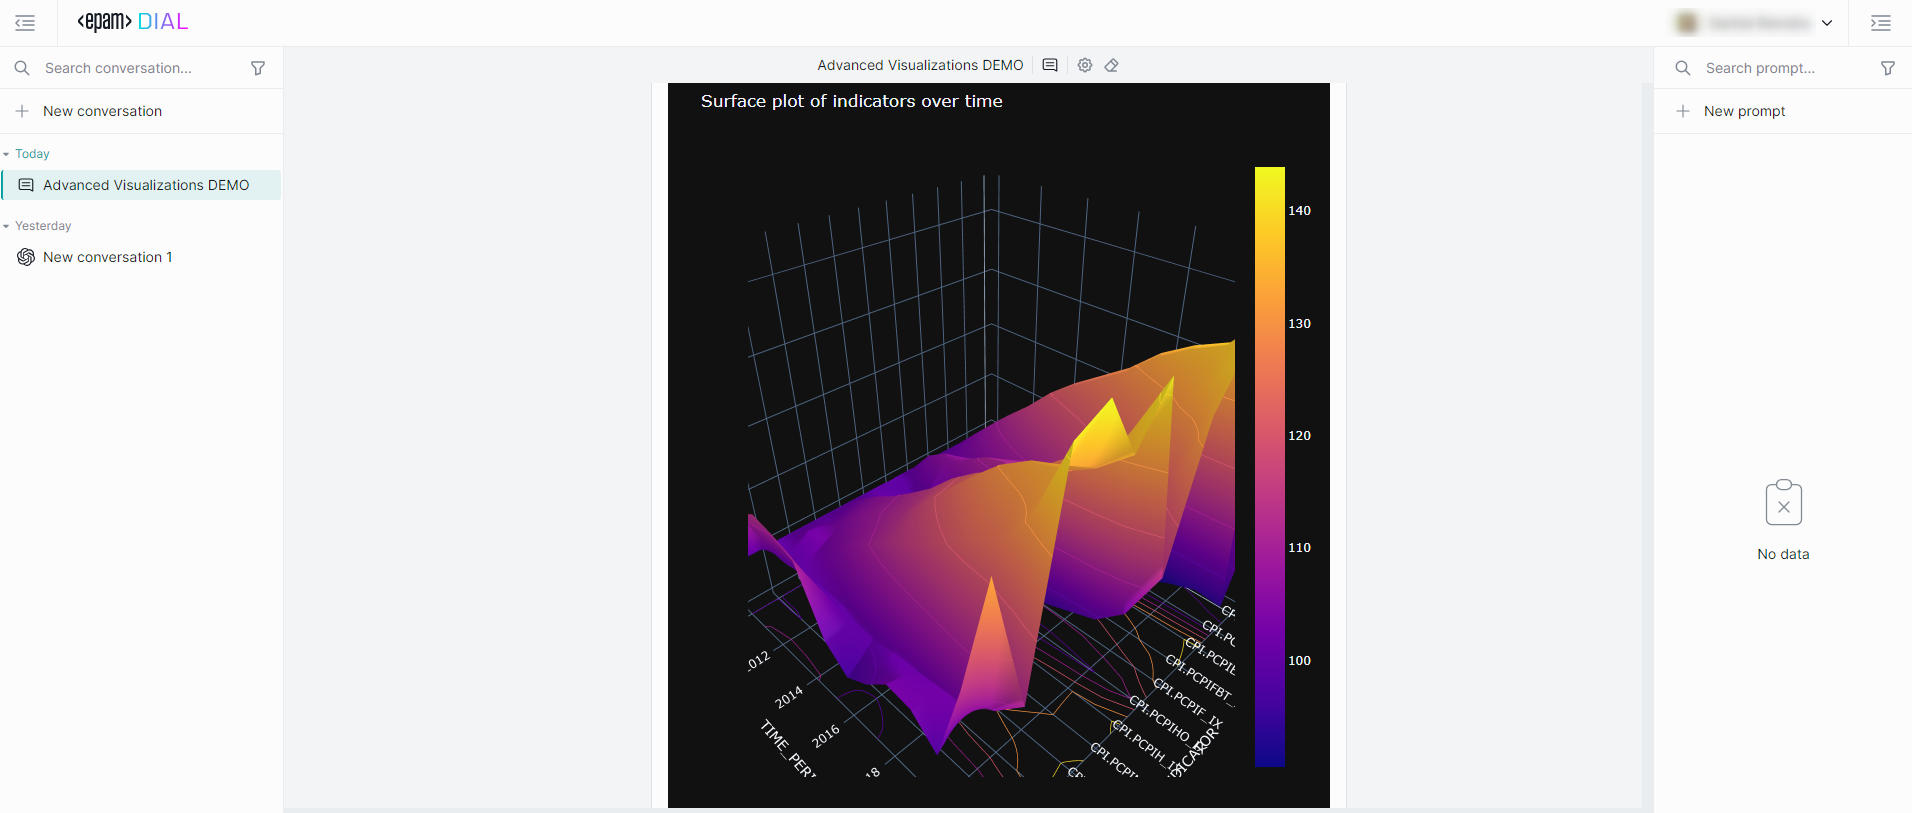
DIAL Chat has built-in support for Plotly JavaScript and React Plotly.js. Plotly charts appear as interactive, zoomable visualizations inside the conversation.
How it works
Your application creates a JSON file following the standard Plotly JSON schema (with data, layout, and optional frames properties), uploads it to DIAL file storage, and returns an attachment pointing to that file. DIAL Chat detects the Plotly MIME type and renders the chart automatically.
Add a Plotly chart with the DIAL SDK
Use choice.add_attachment() in your application's chat_completion method. The url field is the path to the Plotly JSON file in DIAL storage, and the type must be application/vnd.plotly.v1+json:
with response.create_single_choice() as choice:
    choice.append_content("Here is the sales data:")
    choice.add_attachment(
        type="application/vnd.plotly.v1+json",
        title="Sales by quarter",
        url="files/bucket/appdata/app_name/chart.json",
    )
Add a Plotly chart without the SDK
If you build your application without the DIAL SDK, include the attachment in the custom_content object of the HTTP response body:
{
  "role": "assistant",
  "content": "Here is the sales data:",
  "custom_content": {
    "attachments": [
      {
        "index": 1,
        "type": "application/vnd.plotly.v1+json",
        "title": "Sales by quarter",
        "url": "files/bucket/appdata/app_name/chart.json"
      }
    ]
  }
}
See Custom content in Chat — Plotly for the complete field reference and more attachment types.
Custom visualizers
For content types beyond Markdown and Plotly—3D models, domain-specific diagrams, interactive widgets—build a custom visualizer. A custom visualizer is a standalone web application that DIAL Chat loads inside an iframe and passes data to via the ChatVisualizerConnector library.
When to use a custom visualizer
| Approach | Use when |
|---|---|
| Markdown | Tables, formatted text, inline images, LaTeX formulas |
| Plotly | Standard charts—bar, line, scatter, heatmap, 3D surface |
| Custom visualizer | Anything else—protein structures, CAD models, custom dashboards, interactive forms |
Configuration
Custom visualizers require two environment variables in your DIAL Chat deployment:
ALLOWED_IFRAME_SOURCES— space-separated list of allowed iframe origins (for example,http://localhost:8000 https://viz.example.com). Restricts which origins can render inside Chat.CUSTOM_VISUALIZERS— JSON array defining each visualizer's title, MIME types it handles, icon, and URL.
See DIAL Chat configuration for the full environment variable reference.
Getting started
Follow the Create a custom visualizer tutorial for a step-by-step walkthrough of building and deploying a custom visualizer.
Further reading
- Custom content in Chat — full reference for attachments, stages, Markdown, and Plotly in the Unified API
- Create a custom visualizer — step-by-step tutorial for building a custom visualizer
- DIAL Chat configuration — environment variables and feature flags for Chat