Queries [Preview]
Navigate to Analytics → Queries to author, save, and run read-only queries against any analytics table — source, enrichment, or rollup. Use queries to answer questions the pre-built dashboards don't cover, and to keep the answers reusable.
Every query is a saved query: you create it first, then author and run it on its own page. There is no ad-hoc, unsaved query mode.
Personal and Common queries
| Visibility | Who sees it | Who can change it |
|---|---|---|
| Personal | Only you. | You. |
| Common | Everyone with access to Analytics. | Full administrators only. For other users, Save, Edit, and Delete are not available. |
New queries are Personal by default. Choose Common when you create the query, or change it later in Edit a query's details.
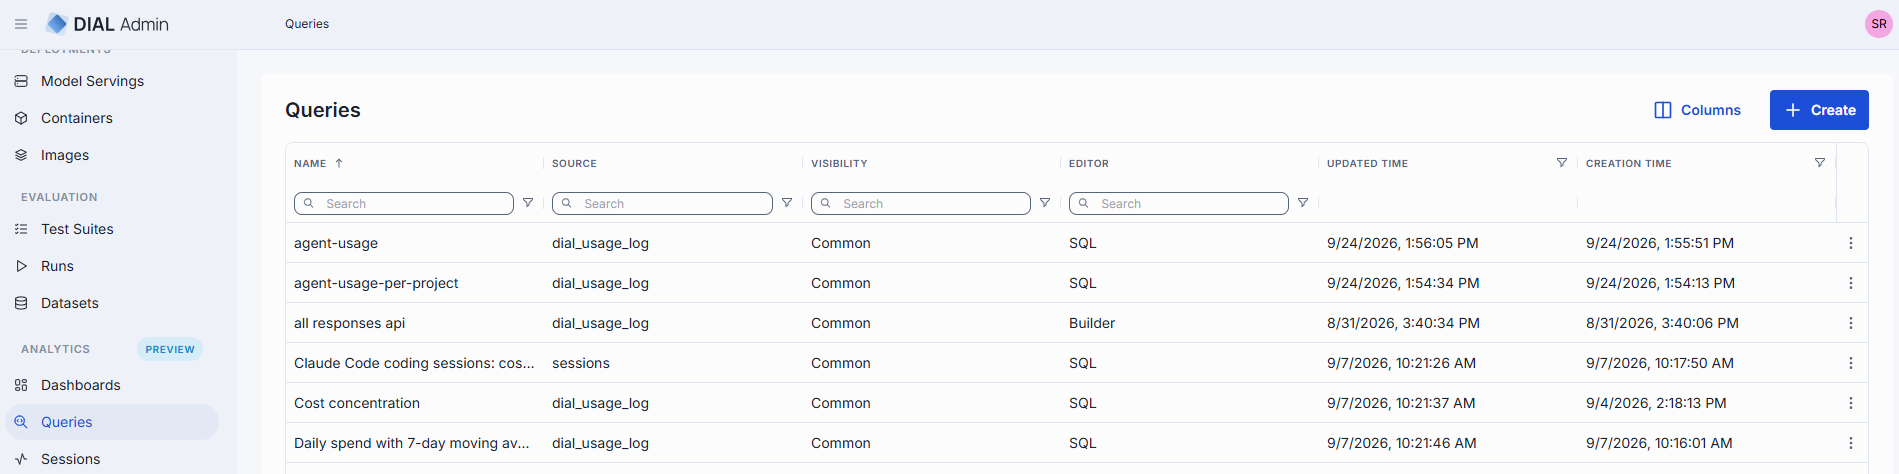
Queries grid
| Column | Description |
|---|---|
| Name | Query name. |
| Description | Free-text summary. |
| Source | Every table the query reads, comma-separated. |
| Tag | Optional label for grouping and filtering. |
| Visibility | Personal or Common. |
| Editor | The view the query opens in: SQL for a SQL query; Builder for a structured query the visual builder can show; JSON for any other structured query. Derived from the saved query, not set by you. |
| Saved by | The query's author. |
| Created time / Updated time | When the query was created and last changed. |
The grid lists your Personal queries and all Common queries together. Sorting and filtering happen in the browser. Click a row to open the query.
Row actions: Open in new tab, Duplicate, Edit, and Delete. Edit and Delete are not offered on Common queries unless you are a full administrator. Use Create to start a new query.
Create a query
Use this to start a new query. You name it here and author it afterwards.
-
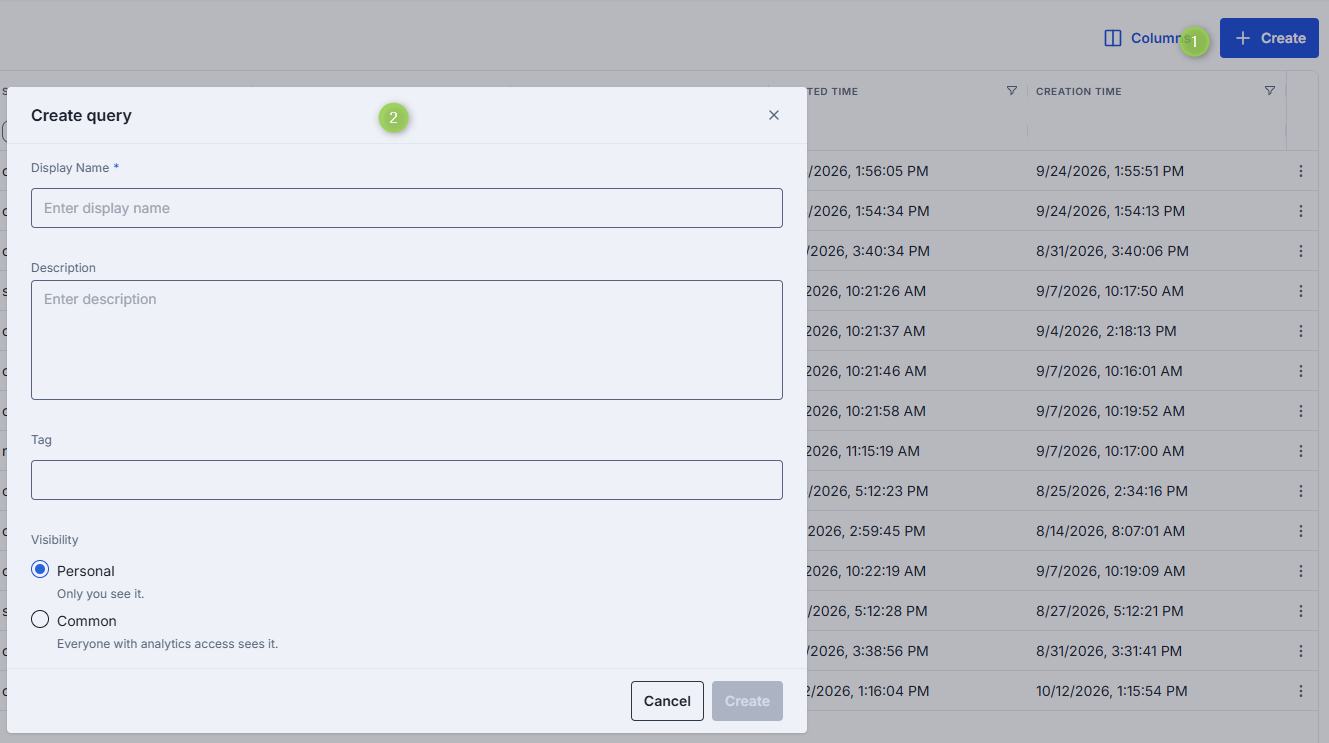
Go to Analytics → Queries and click Create.
-
Enter a Display Name (required). Optionally add a Description and a Tag.
-
Under Visibility, keep Personal (only you see it) or select Common (everyone with Analytics access sees it).
-
Click Create. The modal does not ask for a source. You choose it on the query page.
DIAL Admin creates a row-mode query on the first available table, with the visibility you chose, and opens its page. If creation fails, the modal stays open with your values and an error shows the message and request ID.
The query page
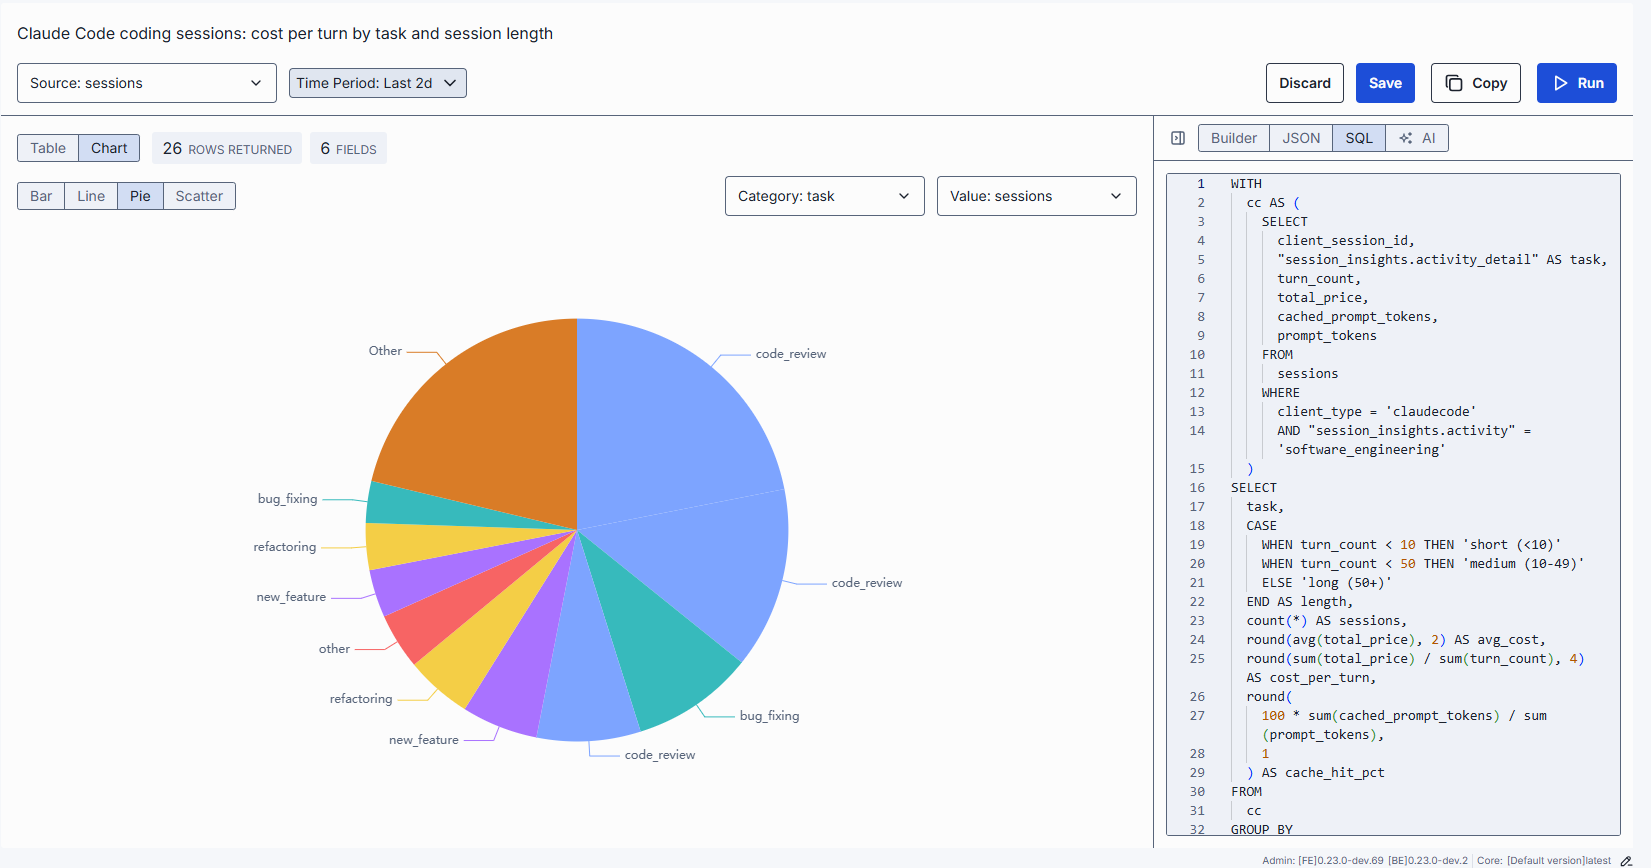
The page shows the query name, a toolbar, the results area, and an authoring panel on the right. The toolbar contains, left to right:
- Source — the table the query reads.
- Time Period — the time window. See Set the time period.
- Edit — change name, description, tag, and visibility. Shown only if you may write the query.
- Discard and Save — shown only while there are unsaved changes.
- Copy — copies the query text (JSON for Builder and JSON views, SQL for the SQL view).
- Run — runs the query. It is disabled until the table's schema loads and while the JSON is invalid.
The authoring panel has these views of the same query:
| View | Use it to |
|---|---|
| Builder | Build the query with a form. |
| JSON | Edit the structured query as JSON. |
| SQL | Write raw SQL, with auto-completion for the selected table. |
| AI | Draft a query from a plain-language request. Shown only when DIAL_QUERY_ASSISTANT_DEPLOYMENT is configured. |
You can collapse the panel to give the results more room.
Build a query in the Builder
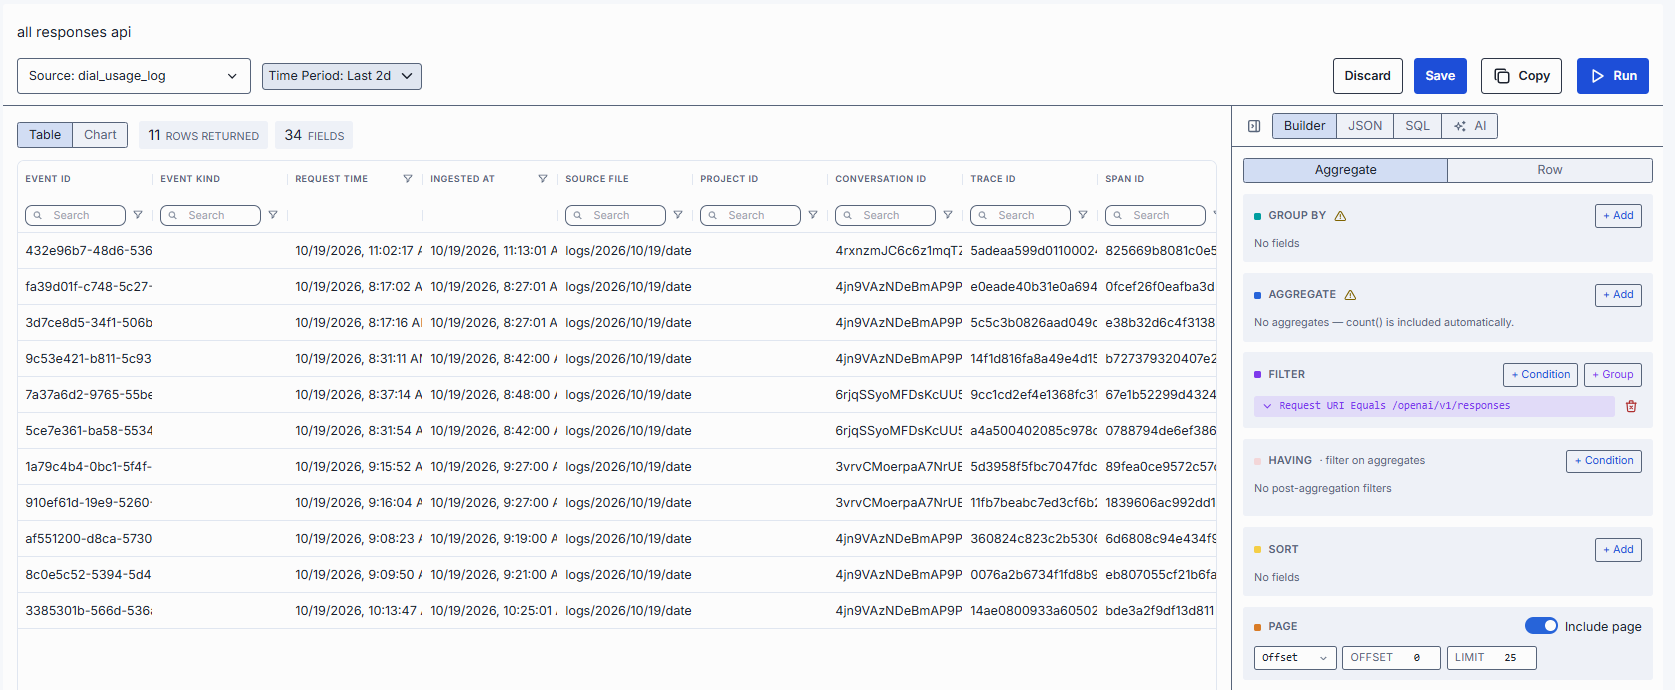
Use the Builder to define a query with a form instead of code. Start by choosing a mode at the top of the panel:
- Row — returns individual records. Use it to look at the data.
- Aggregate — groups records and computes a number per group, such as a count or a sum. Use it for totals and trends. Only aggregate results can be charted.
Which sections do I need?
Most queries need only a few sections. The rest are optional.
| Section | Mode | Use it to | Needed? |
|---|---|---|---|
| Select | Row | Choose which columns to show. If empty, all columns are returned. | Optional |
| Filters | Both | Keep only rows that match conditions. | Common |
| Group by | Aggregate | Split results into groups, such as per status or per day. | Required for grouped results |
| Aggregate | Aggregate | Compute a number for each group, such as a count, sum, or average. | Required |
| Having | Aggregate | Filter the groups after the numbers are computed, such as "only groups with more than 100 rows". | Rare |
| Sort | Both | Order the results by a field, ascending or descending. | Optional |
| Page | Both | Return a limited number of rows, or step through rows. | Rare |
List rows
Example: list the 50 most recently created tickets from a tickets table with the columns ticket_id,
created_at, customer_email, and status.
- Open a query and select Builder. Make sure Row is selected.
- In Source, select the table. In Time Period, select the window to look at.
- In Select, add
ticket_id,created_at, andstatus. - In Filters, add a condition, for example
statusequalsopen. - In Sort, add
created_atand set the direction to Descending. - In Page, turn on paging and set the limit to 50.
- Click Run.
Summarize data
Example: count tickets per status.
- Open a query and select Builder. Select Aggregate.
- In Source, select the table. In Time Period, select the window to look at.
- In Group by, add
status. - In Aggregate, add a count. The result column gets an alias automatically; change it if you want a clearer name.
- Optionally add Sort on the count, Descending.
- Click Run, then switch to Chart to see the counts as a bar or pie chart.
Advanced options
- Filter groups — group conditions to combine them. Groups can nest one level.
- DISTINCT — appears on an aggregate only if its function supports it. Counts each value once.
- Nulls first / last — in Sort, controls where empty values appear.
- Page: Offset or Cursor — Offset takes an offset and a limit, with an optional total. Cursor takes a cursor and a limit.
- Functions — the functions in dropdowns come from the analytics service, so the list depends on your deployment.
- Sensitive fields — marked in the field dropdowns.
- Warnings — an incomplete aggregate, such as a missing function argument, shows a warning that clears when you fix it. Incomplete function entries are left out of the query.
- Contains filters are case-insensitive.
Switch between Builder, JSON, and SQL
The three views edit the same query. Use JSON or SQL for queries the form can't express.
- JSON shows the current query. Edit it and the Builder follows, as long as the builder can represent it. Invalid JSON is flagged and disables Run. Valid JSON the builder can't represent, such as filters nested deeper than two levels, still runs as written and shows an informational message.
- SQL starts empty or with the SQL you last wrote. Run sends the SQL to the analytics service, which validates it and reports errors. If you leave SQL for JSON or Builder, DIAL Admin translates it to a structured query.
- Switching to Builder from SQL or JSON asks for confirmation when the query can't be shown in the form. Confirming drops the written query and resets the builder to its defaults. Cancel to stay in the written view.
While the JSON view is open, changing Source or Time Period updates the JSON. If you have edited the JSON into a form the builder can't show, it is no longer overwritten.

Draft a query with AI
Use this to start from a plain-language question instead of a blank form. The AI view appears only when
DIAL_QUERY_ASSISTANT_DEPLOYMENT is set to the assistant's DIAL Core deployment ID and Analytics is
enabled.
- Select AI.
- Type a request, or click a suggested prompt to fill the input. Click Send.
- Read the reply. If it contains SQL, the SQL is shown under the message with Copy and Run.
- Click Run on a message to load that SQL into the builder and run it. If the builder can't show the query, it stays in the SQL view and still runs.
- Continue the conversation to refine the query.
Notes:
- DIAL Admin sends only the conversation to the assistant deployment. It sends no schema and no row data.
- Changing Source clears the conversation.
- Run and Copy in the toolbar are hidden in the AI view. Use the buttons on each message.
- If a request fails, an error appears and your message stays in the conversation, so you can retry.
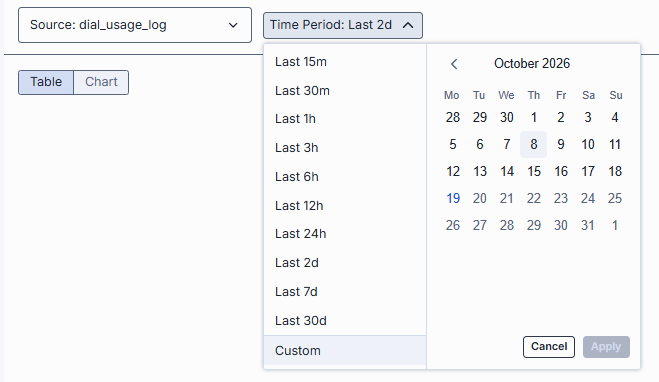
Set the time period
Use Time Period to limit the query to a window.
- A preset period, such as the last N days, is saved as a relative period. When you reopen or re-run the query later, the window moves with the current time.
- A custom range is saved as fixed start and end times.
The period is applied as a filter on the table's first timestamp field. If the table has none, the query has no time bound. The time filter never changes SQL text. In the Builder it does not appear in the Filters section, because Time Period is its editor.
Run a query and read the results
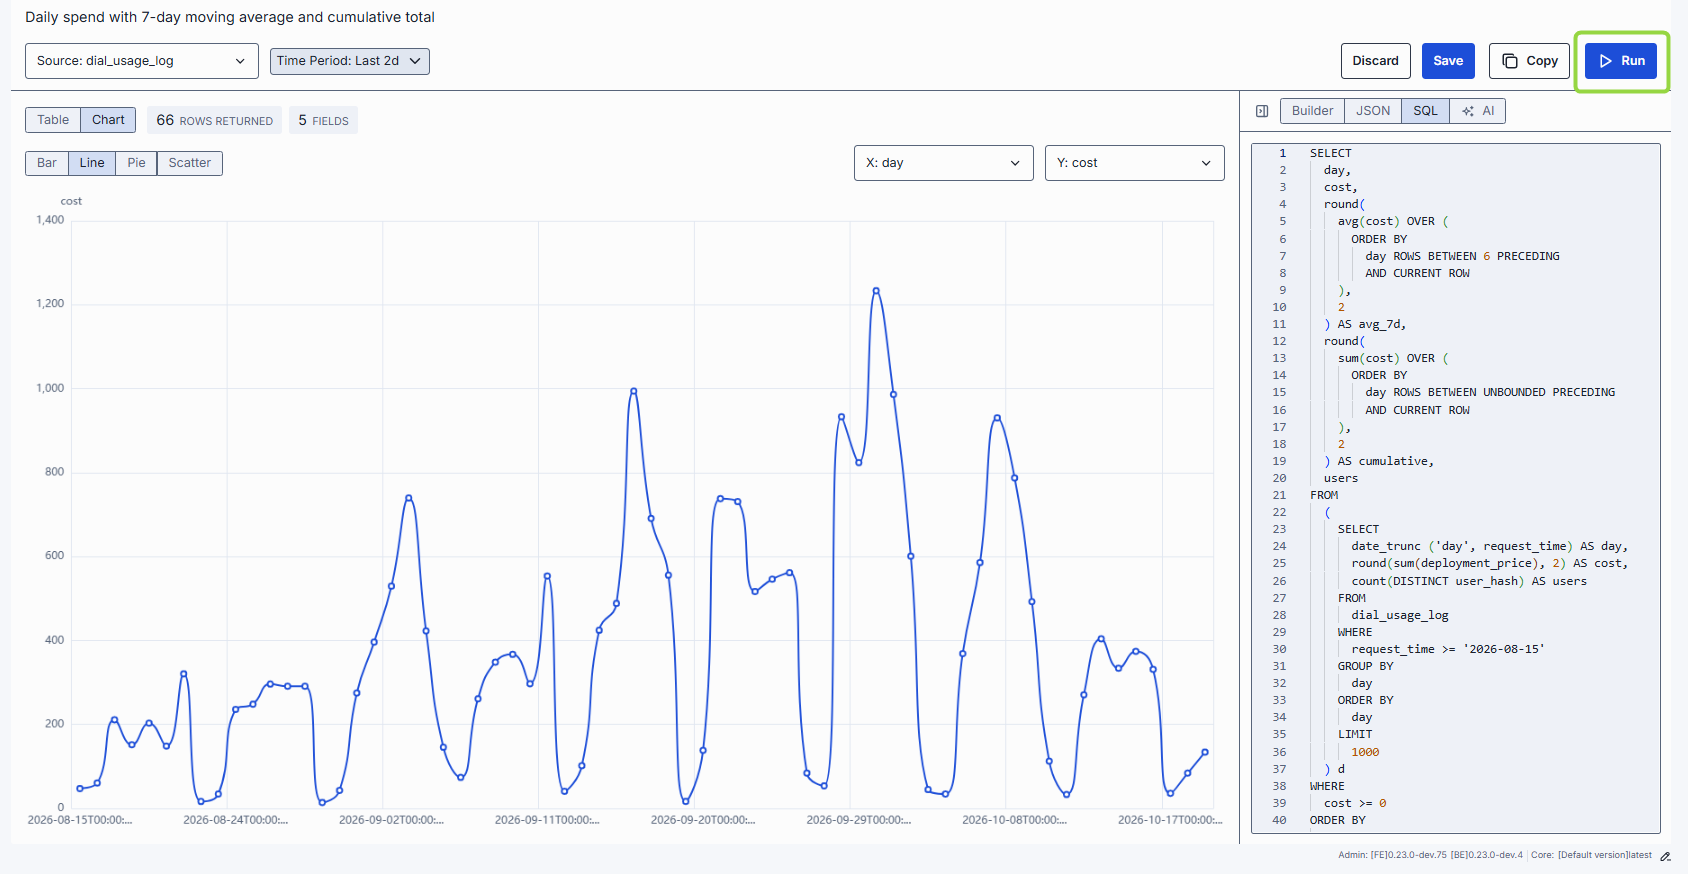
- Click Run. Before the first run, the results area shows an empty state.
- Check the tiles above the results:
- Rows — rows returned.
- Fields — columns returned.
- Total — shown only for row-mode queries with offset paging and the include-total option on. Aggregate and SQL results have no Total.
- Switch between Table and Chart.
Table. Columns use the field's display name. SQL runs use the returned column names. Hover a cell to see the full value. A value too large for a tooltip shows a preview and a control that opens it in a dialog with search, folding, and Copy. Large numbers are shortened and timestamps show in local time. The exact value stays in the tooltip.
Chart is available when the result has at least one group-by column and one aggregate column. Choose the type and columns:
| Type | Columns | Notes |
|---|---|---|
| Bar, Line | X axis (group-by), Y axis (aggregate) | Numeric and date X values are ordered along the axis. |
| Pie | Category, Value | Top 10 categories by value; the rest are grouped as Other. |
| Scatter | X axis, Y axis | Needs at least two numeric columns, otherwise the type is hidden. One point per row. |
When Chart is unavailable, a hint states why: no group-by column, no value column, no rows, or no valid column selected. Row-mode results can't be charted. A SQL run is charted when the SQL can be translated to a grouped query. Otherwise every returned column is offered as a dimension and only all-numeric columns as values.
A failed run shows an error and keeps the previous result.
Save a query
- Change the query, time period, result view (Table or Chart), or chart settings.
- Click Save. The button is available only while there are unsaved changes.
Save stores the query body (Builder, JSON, or SQL), the time period, the result view, and the chart configuration. Name, description, tag, and visibility are changed with Edit. If saving fails, an error is shown and your edits are kept.
To undo, click Discard and confirm. The page returns to the last saved version.

Edit a query's details
- Open the query and click Edit, or use Edit in the grid row menu.
- Change Display Name, Description, Tag, or Visibility. The modal has the same fields as Create a query. Display Name is required.
- Confirm.
This changes only the details. The query body stays as it was.

Duplicate a query
Use this to start a variation of an existing query without changing the original.
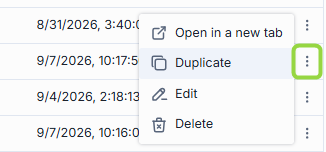
- In the grid, open the row menu and select Duplicate.
- Adjust Display Name, Description, Tag, and Visibility. The name is pre-filled with the original name plus a copy suffix, and the description and tag are copied. Names don't have to be unique.
- Confirm. The copy opens on its own page.
The copy keeps the original's query body, time period, result view, and chart settings. If the analytics service no longer accepts the stored query body, the duplicate fails with the service's message and no copy is created.
Delete a query
- In the grid, open the row menu and select Delete.
- Confirm. The query is removed from the list.
Delete is not offered on Common queries unless you are a full administrator.

Further reading
- Tables — define the data Analytics works with
- Dashboards — monitor usage, cost, and errors
- Pipelines — enrich and aggregate that data
- Sessions — investigate individual conversations