Dashboards [Preview]
Navigate to Analytics → Dashboards for a system-wide, read-only view of usage, cost, latency,
callers, and errors across your DIAL deployment. The dashboard runs aggregate queries over the hop log
(dial_usage_log) — it is not a separate data store.
Note
Dashboards is a [Preview] feature, served when
ANALYTICS_ENABLEDandANALYTICS_USAGE_ENABLEDare set. The same dashboard appears, scoped to a single entity, in each model, application, and toolset's Audit → Dashboard tab.
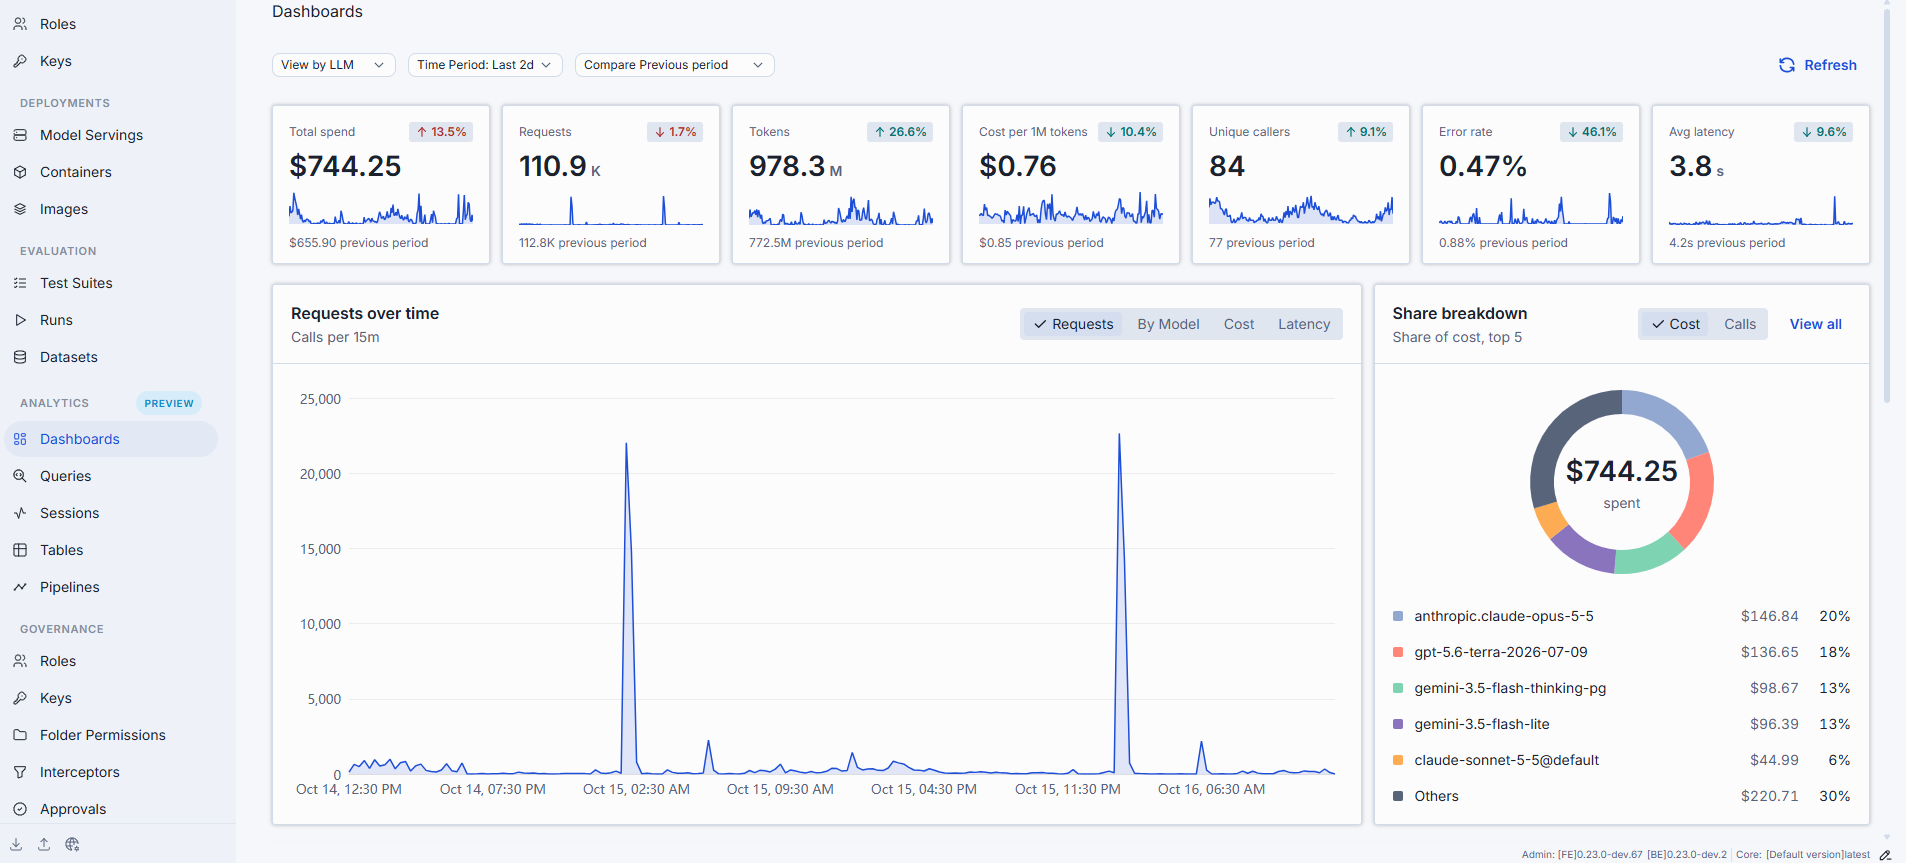
Controls
| Control | Description |
|---|---|
| View by | The top-level lens: LLM, MCP, or Routes. Each lens scopes the metrics and breakdowns to that workload type. |
| Time Period | Date range applied to all cards and charts. Choose a preset or a custom range. |
| Compare Previous period | Adds a period-over-period comparison to each card (previous period, month, or year). |
| Refresh | Reloads the dashboard data. |
Metric cards
Each card shows the current value, a sparkline, and — when comparison is on — the change versus the previous period.
| Metric | Description |
|---|---|
| Total spend | Estimated cost in USD over the selected window. |
| Requests | Number of requests. |
| Tokens | Total prompt and completion tokens. |
| Cost per 1M tokens | Average cost per million tokens. |
| Unique callers | Count of distinct users or API keys. |
| Error rate | Share of requests that failed. |
| Avg latency | Average response time. |

Charts and tables
| Element | Description |
|---|---|
| Requests over time | Time-bucketed chart. Toggle between Requests, a by-dimension breakdown (for example By Model), Cost, and Latency. |
| Share breakdown | Donut chart of the top contributors; toggle between Calls and Cost; View all opens the full list. |
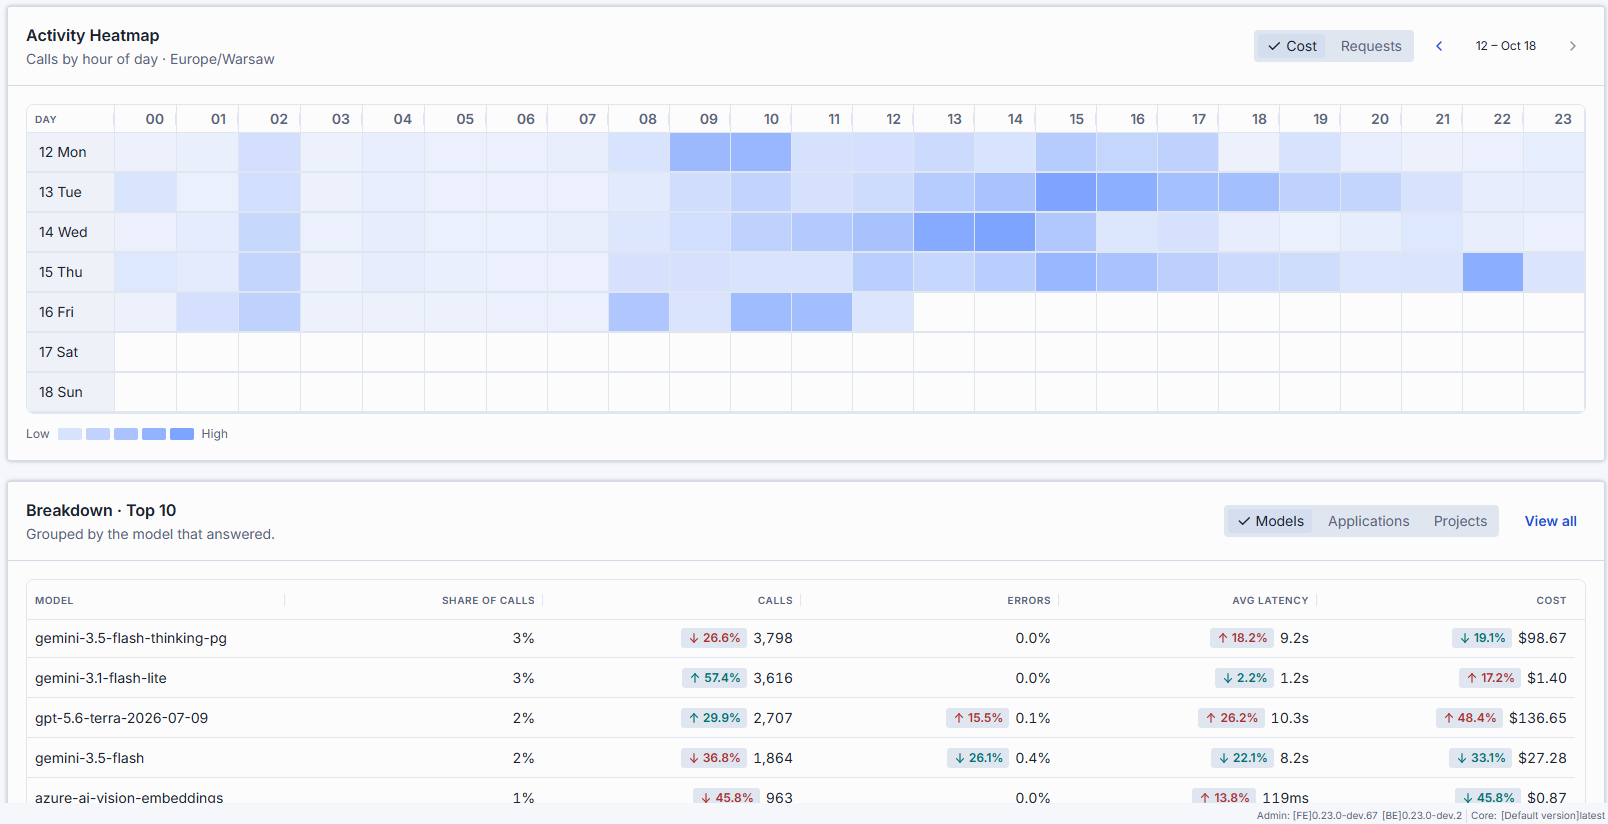
| Activity Heatmap | Calls by hour of day across the week; toggle Requests / Cost; navigate week by week. The color scale runs Low → High. |
| Breakdown | Sortable table grouped by Models, Applications, Projects, MCP servers, or Tools (depending on the selected view), with per-row drill-in. |
Further reading
- Sessions — investigate individual conversations
- Queries — ask your own questions of the data
- Tables — define the data Analytics works with
- Pipelines — enrich and aggregate that data
- Analytics and observability — the two kinds of visibility DIAL gives: usage analytics and runtime health
- Centralized cost and usage governance — limits, attribution, and visibility at the gateway